
Overview
The overview provides a high-level dashboard of your server's status including real-time metrics, quick controls, and customizable widgets.
Server Status
The overview page is your central hub for monitoring your Minecraft server. At a glance, you can see:
System Metrics
| Metric | Description |
|---|---|
| CPU Cores | Number of CPU cores available to the JVM |
| TPS | Ticks Per Second - server performance indicator (20 = perfect) |
| Memory | Current RAM usage and maximum allocated memory |
| Disk | Disk space used by the server directory |
TPS Indicator
The TPS (Ticks Per Second) shows your server's performance:
- 20 TPS: Perfect performance
- 18-19 TPS: Good performance, minor lag
- 15-17 TPS: Moderate lag, may be noticeable
- Below 15 TPS: Significant lag, investigate causes
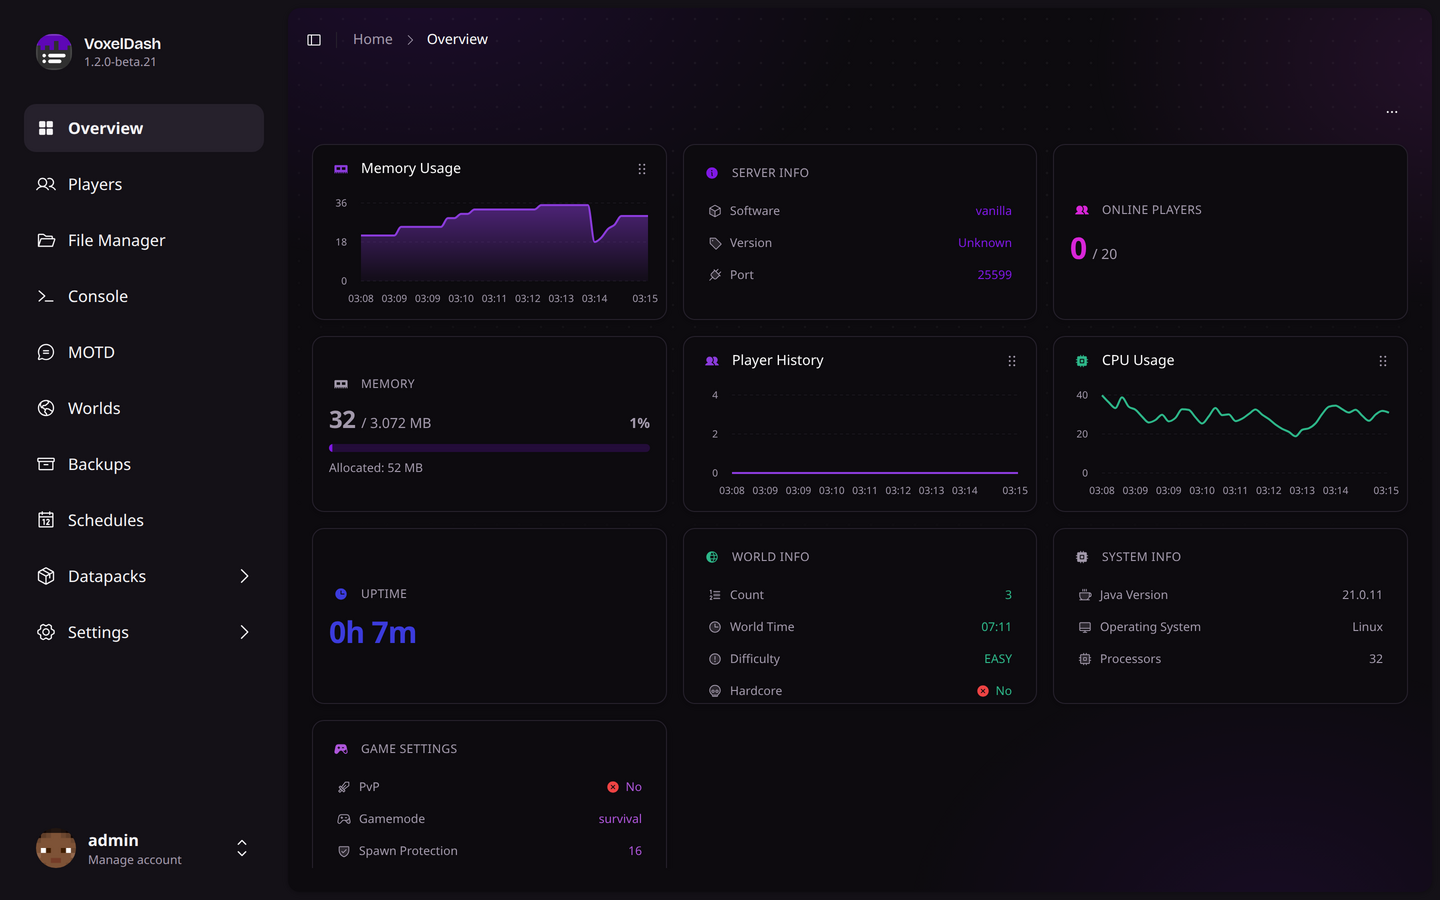
Widgets
The overview is made up of widgets that show different parts of your server at a glance. They all update on their own, so you don't need to refresh the page.
Available Widgets
- Server Info: Software, version, and port
- Online Players: Current and maximum players online
- Memory & CPU: Live usage, both as a number and as a graph over time
- Player History: How the player count has changed recently
- Uptime: How long the server has been running
- World Info: Player count, time, and difficulty of your main world
- System Info: Java version, operating system, and CPU cores
- Game Settings: A quick look at PvP, gamemode, and spawn protection